Seasonally adjusted unemployment rates for all Utah counties have been posted online here.
Each month, these rates are posted the Monday following the Unemployment Rate Update for Utah.
For more information about seasonally adjusted rates, read a DWS analysis here.
Next update scheduled for March 26th.
Showing posts with label Data Releases. Show all posts
Showing posts with label Data Releases. Show all posts
Monday, March 5, 2018
Friday, March 2, 2018
Utah's Employment Situation for January 2018
Utah's Employment Situation for January 2018 has been released on the web.
Find the Current Economic Situation in its entirety here.
For charts and tables, including County Employment, go to the Employment and Unemployment page.
Next update scheduled for March 23rd, 2018.

Find the Current Economic Situation in its entirety here.
For charts and tables, including County Employment, go to the Employment and Unemployment page.
Next update scheduled for March 23rd, 2018.
Monday, August 3, 2015
Updated Economic Snapshots

For the latest economic snapshot for your county, check out the updated files on our website for Grand and San Juan counties.
Note: refreshing browser may be necessary for current information.
Monday, April 27, 2015
Grand County Economic Update
Tyson Smith, Regional Economist
The Utah Department of Workforce Services (DWS) relies on several data sources to help describe the state of the economy. The most accurate data available is the nonfarm payroll employment information that is collected through the Quarterly Census of Employment and Wages. However, the resources required to gather data accurately come at the expense of timeliness, which results in a four to six month lag between the time these data are collected and when they are available to the public.
Other data are collected in a timelier manner, and these data (along with historical trends) provide a foundation to estimate current economic conditions. Economists at DWS rely heavily upon statistical models, surveys, and limited datasets to evaluate the economy in real-time. Some of those tools, like the county unemployment rates and initial weekly unemployment claims, are highlighted in this article.
The truth is that no single source of economic data exists that can appropriately profile the labor market in real-time. So, when evaluating regional economies it is important to understand the recent economic history of the area, while also using any up-to-date information available despite the limitations of present data.
San Juan County Economic Update
Tyson Smith, Regional Economist
The Utah Department of Workforce Services (DWS) relies on several data sources to help describe the state of the economy. The most accurate data available is the nonfarm payroll employment information that is collected through the Quarterly Census of Employment and Wages. However, the resources required to gather data accurately come at the expense of timeliness, which results in a four to six month lag between the time these data are collected and when they are available to the public.
Other data are collected in a timelier manner, and these data (along with historical trends) provide a foundation to estimate current economic conditions. Economists at DWS rely heavily upon statistical models, surveys, and limited datasets to evaluate the economy in real-time. Some of those tools, like the county unemployment rates and initial weekly unemployment claims, are highlighted in this article.
The truth is that no single source of economic data exists that can appropriately profile the labor market in real-time. So, when evaluating regional economies it is important to understand the recent economic history of the area, while also using any up-to-date information available despite the limitations of present data.
The Utah Department of Workforce Services (DWS) relies on several data sources to help describe the state of the economy. The most accurate data available is the nonfarm payroll employment information that is collected through the Quarterly Census of Employment and Wages. However, the resources required to gather data accurately come at the expense of timeliness, which results in a four to six month lag between the time these data are collected and when they are available to the public.
Other data are collected in a timelier manner, and these data (along with historical trends) provide a foundation to estimate current economic conditions. Economists at DWS rely heavily upon statistical models, surveys, and limited datasets to evaluate the economy in real-time. Some of those tools, like the county unemployment rates and initial weekly unemployment claims, are highlighted in this article.
The truth is that no single source of economic data exists that can appropriately profile the labor market in real-time. So, when evaluating regional economies it is important to understand the recent economic history of the area, while also using any up-to-date information available despite the limitations of present data.
Monday, March 9, 2015
Monthly Consumer Price Index (CPI) updated
The Consumer Price Indexes (CPI) program produces monthly data on changes in the prices paid by urban consumers for a representative basket of goods and services.
There is no CPI data specific to Utah, so national data is relied upon for this page.
For monthly and annual CPI data see here.
There is no CPI data specific to Utah, so national data is relied upon for this page.
For monthly and annual CPI data see here.
Tuesday, February 10, 2015
Grand County Economic Update
Regional payroll employment shrinks slightly in the third quarter
Tyson Smith, Regional Economist
Tyson Smith, Regional Economist
Broad-based economic growth does not always portend positive economic conditions in every community. Utah has seen significant labor market expansion over the last four years, growing at an annual rate of about 3 percent since 2011. And yet, economic recovery in the Southeast region has been less than consistent.
The two counties in the Southeast region – Grand and San Juan – have moved in opposite directions since 2011. Grand County has been consistently adding employment over the last four years except for a brief period in 2013. San Juan County has consistently shed employment during the same period, except for a nine-month window from mid-2013 to early 2014.
Grand County
- Grand County has been the exception among the Castle Country and Southeast counties in terms of payroll employment growth. The 2.9 percent year-over job growth in third quarter 2014 was above the state average, and the county has been consistently adding employment since July of 2013. On average, the county added 158 jobs from third quarter 2013 to third quarter 2014. The educational/health/social services and professional services industries were the big contributors, adding 70 and 46 employees, respectively.
- The recent momentum in the county’s labor market has had a dramatic effect on the seasonally adjusted unemployment rate, which has fallen from 7.1 percent in December 2013 to 5.7 percent in December. However, the 5.7 percent represents an upturn since September, and is still notably higher than the Utah average (3.5 percent).
- The recent rise in the county’s unemployment rate is not reflected in the initial unemployment claims data. The number of initial weekly claims filed in the fourth quarter of 2014 was down 23.5 percent from 2013. Given the underlying trend of initial claims, the unemployment rate may stabilize in the short term.
- As the labor market continued its momentum in the third quarter of 2014, so did average wages in the county. Year-over average monthly wages grew 2.8 percent – or 1.3 percentage points faster than the Utah rate. The service-producing industries saw the largest increases, most notably in leisure/hospitality which increased average monthly wages 4 percent.
- Third quarter 2014 taxable sales in Grand County rose by 13.3 percent from 2013, the third largest increase in the state. Accommodation and mining sales increased more than any other industries in the county, improving $4.8 million and $1.3 million, respectively, from third quarter 2013.
San Juan County Economic Update
Regional payroll employment shrinks slightly in the third quarter
Tyson Smith, Regional Economist
Broad-based economic growth does not always portend positive economic conditions in every community. Utah has seen significant labor market expansion over the last four years, growing at an annual rate of about 3 percent since 2011. And yet, economic recovery in the Southeast region has been less than consistent.
The two counties in the Southeast region – Grand and San Juan – have moved in opposite directions since 2011. Grand County has been consistently adding employment over the last four years except for a brief period in 2013. San Juan County has consistently shed employment during the same period, except for a nine-month window from mid-2013 to early 2014.
San Juan County
- San Juan County’s employment growth continued to erode in the third quarter of 2014. The county shed a quarterly average of 47 jobs from third quarter 2013 to third quarter 2014, or approximately 1.1 percent. This marked the second consecutive quarter of year-over job losses. The goods-producing industries – down 11.9 percent – accounted for the majority of the job losses. Mining employment fell 14 percent, which represents a quarterly average of 53 fewer jobs.
- As job growth stagnated in the county, unemployment remained relatively high. The rate settled at 8 percent in December (up from 7.8 percent in August), which is the third highest among Utah’s 29 counties. San Juan County’s unemployment rate is still markedly higher than both the state and national averages.
- Fourth-quarter initial unemployment claims paint a more optimistic picture. During the last three months of 2014 the average number of initial weekly unemployment claims fell 24.6 percent from the same time last year. On the other hand, the first few weeks of 2015 show signs that the positive trend may be reversing as initial claims have risen by an average of five claims per week (up 53.2 percent from 2013).
- Average monthly wages in the county also declined slightly. Weakening in the service-providing industries, particularly retail trade and government contributed to falling wages.
- Third quarter 2014 taxable sales in San Juan County fell 17 percent from third quarter 2013. The county experienced a drop in year-over taxable sales growth for the fourth time in the last five quarters. Taxable sales in mining/quarrying/oil and gas extraction fell by $3.5 million, more than any other industry.
Thursday, October 23, 2014
Employment by Major Industry
Employment by Major Industry (or Nonfarm Employment) is compiled payroll data for nonfarm workers. Nonfarm workers are all employees excluding government employees, private household employees, employees of nonprofit organizations and farm employees. DWS economists have broken these documents into county regions and are an important economic indicator of the current economic situation. For more: Why no "Farm" in Nonfarm Jobs?
Second quarter 2014 has been updated for counties in the Southeast region. These can be found on each county's page in the links to right, as well as below.
Second quarter 2014 has been updated for counties in the Southeast region. These can be found on each county's page in the links to right, as well as below.
Tuesday, July 22, 2014
New County Pages
 See our new County Pages, each with their own URL for easy bookmarking. Find labor market information that has been divided into counties and regions for a quick look at each area.
Also find a new look for the Current Economic Snapshots (Grand and San Juan). These are economic snapshots are a two-page look at the current information for labor force, sales, building and unemployment insurance for each county in Utah, and are updated monthly after the Employment Situation.
These can be accessed on the Utah Economic Data page or on the Labor Market page under the "County Snapshots" link.
Monday, June 9, 2014
Long-term Industry Projections available on the web
Job seekers who make decisions based on labor trends information are more likely to see payoff for their efforts. An important aspect of career exploration is understanding how occupations and industries are expected to change. To assist in this process, the Department of Workforce Services (DWS) produces long-term industry projections every two years for the major industry sectors in Utah, providing information on the state’s expected labor demands. The long-term projections extend ten years past the base year. Using the industry projections, DWS generates occupational projections for jobs that fall into the industry categories.
To access the most recent set of long-term industry projections, click here.
To access the most recent set of long-term industry projections, click here.
Friday, May 16, 2014
New Data Available in Utah Economic Data Viewer
The 2013, Q4 industry employment and wages data has been updated in the Utah Economic Data Viewer. Industry employment and wage data is collected through the Quarterly Census of Employment and Wages (QCEW) program. The primary source for QCEW data are the reports submitted by employers to the Utah Unemployment Insurance program.
The Utah Department of Workforce Services compiles quarterly employment and wage data for non-agricultural employers in Utah. Data is maintained at the establishment level (e.g., store, plant, or other type of permanent worksite facility). Since these establishments are assigned an industry and county code, their employment and wage data can be aggregated into common industry and county groupings for analysis purposes.
The Utah Department of Workforce Services compiles quarterly employment and wage data for non-agricultural employers in Utah. Data is maintained at the establishment level (e.g., store, plant, or other type of permanent worksite facility). Since these establishments are assigned an industry and county code, their employment and wage data can be aggregated into common industry and county groupings for analysis purposes.
Tuesday, January 7, 2014
Utah Employers, Employment and Wages by Size, 2013
The Utah Department of Workforce Services compiles quarterly employment and wage data for non-agricultural employers in Utah. Data is maintained at the establishment level (e.g., store, plant, or other type of permanent worksite facility). Since these establishments are assigned an industry and county code, their employment and wage data can be aggregated into common industry and county groupings for analysis purposes.
Employment and wage data for Utah’s non-agricultural employers are categorized in this publication by employment size for the month of March in each of the designated years. Grouping data by this criterion provides a useful tool to analyze the characteristics of Utah employers. For example, general trends of the size of Utah employers and employment concentrations by employer size class can be observed. Wage levels for large, medium, and small firms can also be evaluated.
In this publication, data is presented for both establishments and firms. The term "establishment" is generally defined as a specific physical worksite for an employer. For most employers, this is the actual street location at which business is conducted. For others, with no permanent worksite (such as salespeople, factory representatives, or distributors) it is the location from which they conduct their business (sometimes even residences).
For an overview of this publication and a look at your county, click here.
Wednesday, December 12, 2012
Census Bureau releases EEO Tabulation
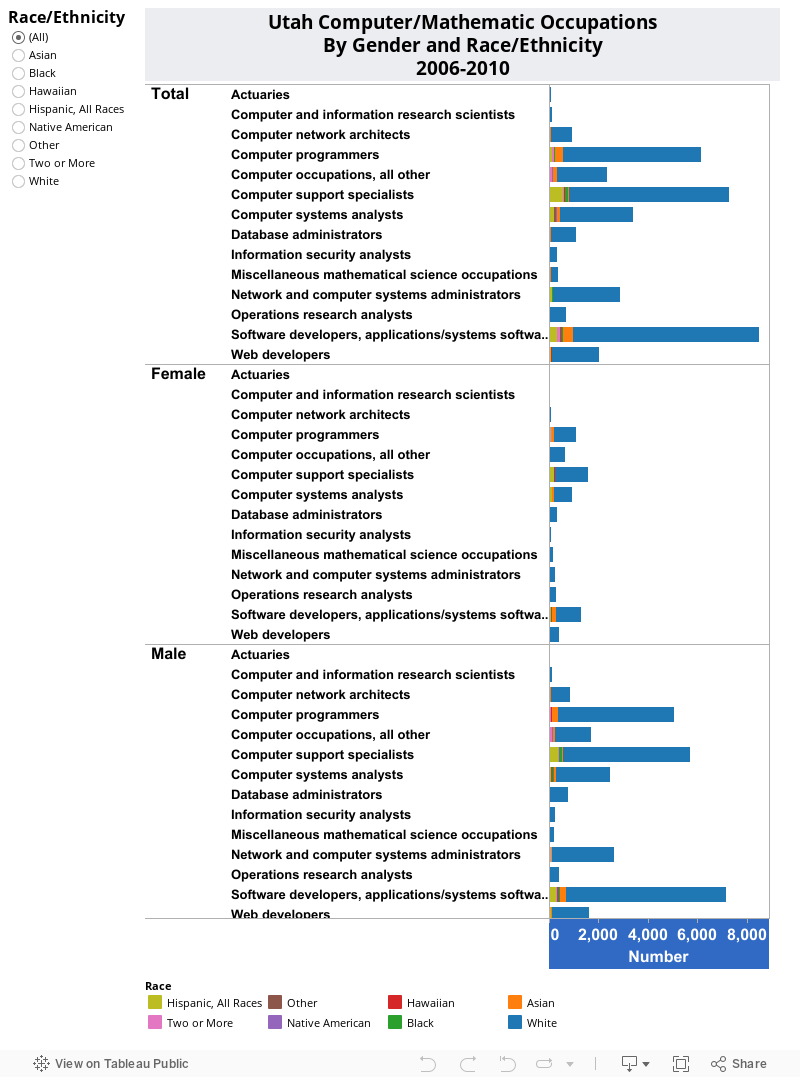
If you are required to submit an EEO-1 report to the federal government, or you are just interested in occupational data, you’ll be pleased to know that the Census Bureau has released the first new Equal Employment Opportunity tabulation in almost a decade.
This tabulation uses the 2006-2010 American Community Survey (ACS) 5-year estimates rather than the decennial Census data of past eras. This tabulation is a collection of detailed tables that provide extensive detail about the workforce composition and work characteristics of people across the country.
The EEO Tabulation presents a variety of tables featuring the following variables: detailed occupation (488 categories), EEO occupational groups (14 categories), EEO-1 job categories (9 categories), state and local job groups (8 categories), federal sector job categories (9 categories), industry (90 categories), race and ethnicity, citizenship, sex, educational attainment, older age groups, younger age groups, earnings, unemployment and when last worked.
The visualization that accompanies this post shows just a fraction of the information that is available for detailed occupations. As usual, you can access the EEO data via American Factfinder.
Not all tables are available for all geographies. For Utah, the tables are available for the state and the following counties, places and some Metropolitan Statistical Areas, including:
• Box Elder County
• Cache County
• Davis County
• Salt Lake County
• Tooele County
• Utah County
• Washington County
• Weber County
• Layton City
• Millcreek CDP
• Ogden City
• Orem City
• Provo City
• St. George City
• Salt Lake City
• South Jordan City
• Taylorsville City
• West Jordan City
• West Valley City
These tables are available by residence geography (where people live), worksite geography (where people work), and commuting flows (tables showing a central worksite and the flow to that worksite of workers from up to nine sources). Data outlined in the tables includes, gender, race/ethnicity, educational attainment, industry, unemployment status, citizenship status, and earnings.
Tuesday, May 3, 2011
Moab UMTRA Project Impact Analysis
Economist John Krantz has put together an economic impact analysis, specifically examining the job creation associated with ARRA funding for the acceleration of the Department of Energy's Moab Uranium Mill Tailings Remedial Action (UMTRA).
For a direct link to the study:
The study can be found with other Workforce Research & Analysis publications at:
Thursday, April 22, 2010
New County-Level Personal Income Data Available
The Bureau of Economic Analysis (BEA) has released estimates of personal income at the county level for 2008 based on newly available source data. The county estimates released today complete the successively more detailed series of data releases depicting the geographic distribution of the nation’s personal income for 2008.
The annual estimates (1969-2008) of local area personal income have been revised to incorporate the comprehensive revision of the National Income and Product Accounts (NIPA). Comprehensive revisions, which are undertaken every 4 to 5 years, are an important part of BEA’s regular process for improving and modernizing its accounts to keep pace with the ever-changing U.S. economy. Bureau of Economic Analysis
The annual estimates (1969-2008) of local area personal income have been revised to incorporate the comprehensive revision of the National Income and Product Accounts (NIPA). Comprehensive revisions, which are undertaken every 4 to 5 years, are an important part of BEA’s regular process for improving and modernizing its accounts to keep pace with the ever-changing U.S. economy. Bureau of Economic Analysis
Subscribe to:
Posts (Atom)