Tuesday, November 8, 2016

Older Utahns in Grand County

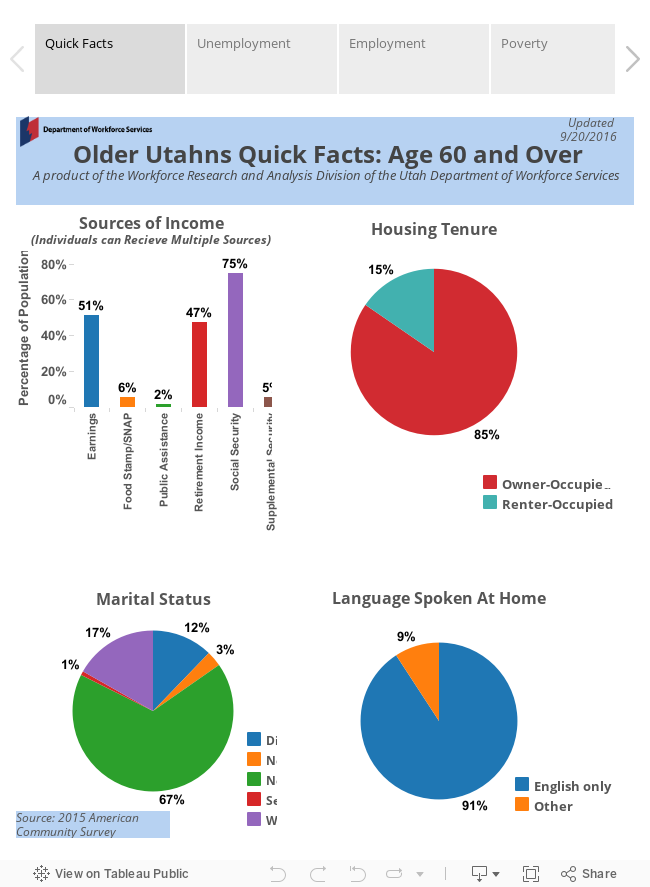
The Department of Workforce Services has just published an interactive graphic on older Utahns. Based on 2015 Census Bureau data, it allows researchers (and the simply curious) to “drill down” to the county level.

Roughly 15 percent of the state’s population is age 60 and older. Further, workers age 55 and older make up 17 percent of the labor force. As the population “greys”, the economic importance of older Utahns will naturally become of greater importance. The Deseret News recently reported that in 2015 there were 337 people in Utah over the age of 100. In 50 years, there will be nearly 7,000.
As an example of the information available and the potential for insights, this post will focus on Grand County.

The visualization has six profile segmentations, each represented by a “tab” above the graphs that one can click on. The first tab is a statewide overview of Utahns age 60 and older. From this the reader can generalize that about half of older Utahns still receive taxable income (either passive or active) and/or retirement income. Around 5 percent qualify for some form of public assistance. The typical older Utahn owns his or her home, is married, and speaks English.

The second tab shows unemployment rates by county and age. Older working age Grand County residents experience lower unemployment than the state as a whole, although the relationship reverses when for the post 65 year old cohort.

Tab three shows that this rate is real rather than ephemeral; the labor participation rates up to age 62 are significantly higher than statewide. After age 62, the comparison reverses; older Grand County males are then less likely to participate in the labor force. This pattern seems to be consistent throughout Eastern Utah. Analysts believe that that the higher participation for workers under age 62 are out of necessity; private sector jobs that provide retirement plans are not as common in rural areas. The lower participation rates after age 62 could be a function of the availability of social security and the more physical nature of occupations in rural areas.

The fourth tab shows the older population sorted by poverty level which is $11,670 for an individual. Poverty is much more common in the county than it is statewide. The proportion of residents at the highest end of the scale (more than 400 percent of poverty or $46,680) is less in the county than statewide for older Utahns in the age 55 to 64 cohort but almost exactly the same for the retirement age cohorts. This is most likely a function of migration; urban retirees are drawn to the area and skew the profile toward the statewide statistics.

The fifth tab displays insurance coverage differentiated by educational attainment for older Utahns. Note that there is no display for persons without coverage; due to Medicare, that number is statistically zero for both Grand County and the state as a whole for persons over age 65. Give the inferred prevalence of urban retirees, it is not surprising that so many Grand County residents over age 65 are covered by private insurance. Private insurance coverage also correlates with education. Better educated workers have better noncash benefits and would therefore prefer their private plan over the public options.

The sixth and final tab shows disability rates for older Utahns. Disability rates for Grand County resident are generally the same as for older Utahns statewide. It is somewhat puzzling to observe that the county rates for the age 75 and older cohorts are similar to the state’s. Given, the absence of substantial medical infrastructure, one who assume that disabled county residents would leave the area and therefore depress the disability rate.

Wednesday, October 19, 2016

Show Me the Economy

Mark Knold, Supervising Economist 

“The government knows everything about everyone.”

 Fortunately, that statement is not true. Yet society still looks to the government to provide answers to comprehensive and complex questions that have their foundation within individual decisions and activities. One subject frequently directed toward the government is individual-level information about the economy — particularly, what occupations are in demand, what occupations pay well and have lucrative outlooks, and ultimately, what occupation(s) should I build my career upon?

It takes the accumulation of a wide array of individual information to answer these questions. Employers provide the foundation information about the occupations they employ. Jobs are held by individuals, but employers provide the profile information about the job itself, not any particular individual.

Since society desires to profile such a broad spectrum of the economy — occupational profiles and the occupational distribution within the economy — only government is in the unique position to collect, analyze and provide answers for said desire. Yet, no government program or regulatory agency mandates any comprehensive occupational reporting from individuals or businesses. Therefore, government attempts to fill the void with an ongoing, robust and voluntary survey of employers — a survey where employers are asked to provide details about their various occupations; including descriptions, quantities, wages/salaries and location. Through this survey emerges an occupational portrait of an economy.

The U.S. Bureau of Labor Statistics (BLS) structures and funds the survey, yet the individual states conduct the survey. Under BLS administration, all states use the same methodology; therefore, occupational profiles are comparable across states.

Through this survey, analysts discover how industries are populated with various occupations. Accountant is an occupation, yet accountants can be found across many different industries. Other occupations may be more exclusive to certain industries; for example, doctors are largely found only in the healthcare industry. One of the survey’s products is that industries can be profiled with their general mix of occupations. This is called an industry’s occupational staffing pattern.

This brings us back to the original questions: what occupations are in demand, what occupations pay well and have lucrative outlooks, and ultimately, what occupation(s) should I build my career upon? The foundation is to make informed forecasts about how industries will expand/contract over the next 10 years. By applying existing occupational staffing patterns to each industry’s projected change, a trained economic analyst can then make an extrapolation about how occupations will correspondingly increase/decrease. Knowledgeable analyst judgment further refines the occupational expectations, such as knowing an occupation will grow faster than in the past, with the result being a set of occupational projections that accumulate to profile a state or regional economy.

A new set of occupational projections are done every two years to keep the information fresh even though economies do not change dramatically in short order. Because of slow change, updated occupational projects generally continue the overall message of preceding occupational projections. But economies do modify with time, and therefore, subtle changes will arise with each new set of occupational projections.

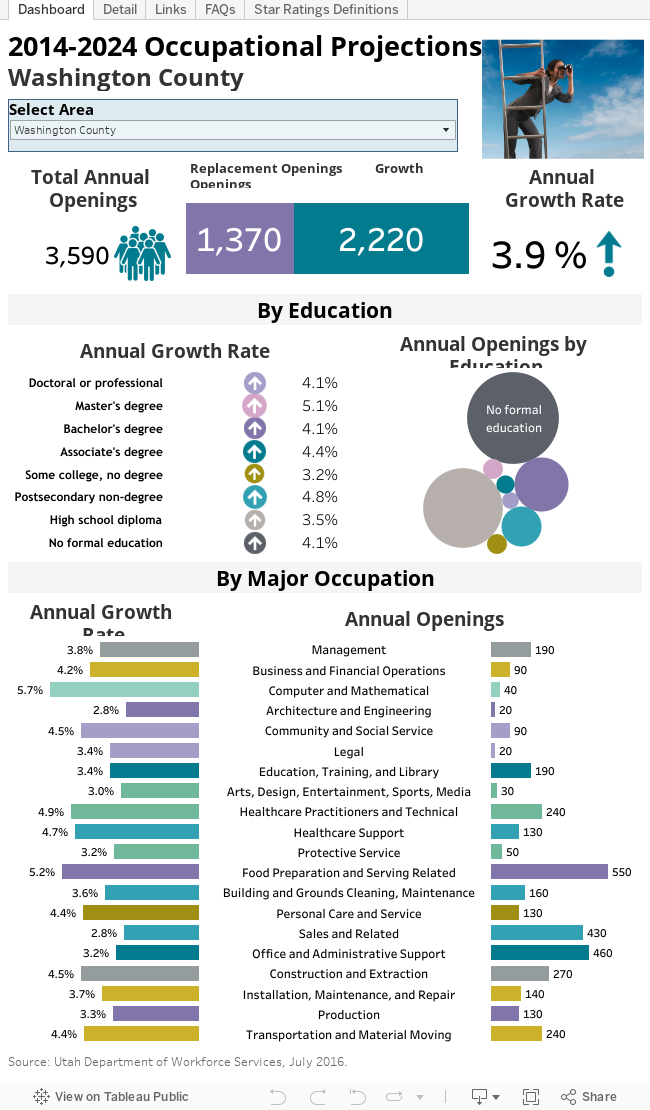
Utah’s most recent occupational projections are found here: http://www.jobs.utah.gov/wi/pubs/outlooks/state/index.html. These projections look forward to the year 2024.

The occupational profile is structured from the general to the detailed, mimicking the structure of a family tree. First, broad occupational categories are defined, such as management or healthcare occupations; then, subcategories are defined; and finally, individual occupations are defined. Individual occupations are the heart of the occupational projections. But overall patterns and characteristics do emerge when observing the broader categories.

While a Utah statewide profile leads the way, Utah’s local economies are not homogenous; therefore, nine Utah subregions are also profiled. Due to confidentiality restraints and statistical reliability, the amount of occupations available will diminish the smaller a subregion; but, occupations comprising the backbone of a regional economy will be available.

Eastern Region Highlights

Scott Smith, Regional Economist

The Eastern Region labor market is dominated by resource extraction industries. Roughly 15 percent of all 2014 jobs (the base year for the projections) are counted in the mining sector. A further 4 percent are involved in the short haul trucking industry — businesses that are almost exclusively hauling coal, oil and gas-related products. Alternately, a little more than half the jobs in the Eastern Region are located in the oil-rich Uintah Basin. Employment in Uintah and Duchesne counties is highly dependent on the price of oil and subject to the volatility of the commodity cycle. It is an understatement to note that the oil and gas industry is currently in a slump. In addition, Carbon and Emery counties both have a relatively large number of active coal mines, an industry facing its own challenges.

Given these headwinds, Eastern Region employment is projected to grow by only 0.8 percent annually through 2024. Total oil and gas employment is projected to grow at 0.1 percent annually. Coal mining employment is expected to decline by 1.3 percent annually. Construction, which is currently 6 percent of the total jobs, is naturally expected to follow this trend and is projected to increase by only 0.3 percent annually.

Table 1 shows the top six sectors in terms of new jobs. These 2,546 jobs comprise a little more than 60 percent of the projected Eastern Region total.


 With the exception of Junior Colleges and Restaurants and Eating Places, growth is expected to be sluggish.

Occupations related to the restaurant industry are expected to add the greatest number of net new jobs. Combined food preparation/serving workers and waiters/waitresses are expected to add more than 13 percent of net new jobs over the forecast horizon. The entry level salary for these jobs range from $16,888 to $17,010.
While cashiers are expected to add a substantial number of jobs annually, the total number of jobs is expected to shrink over the forecast horizon. The high number of annual openings is entirely a function of turnover. Entry level cashier jobs in the Eastern Region pay $17,220.

Heavy truck drivers are expected to add almost 5 percent of net new jobs. These jobs pay $39,400 to start and require some post-secondary education.

For occupations requiring at least a bachelor’s degree, the teaching occupations generate the largest number of net new positions. These jobs are projected to comprise 10 percent of all net new jobs. The vast number of these jobs are involved in primary or secondary education and start around the mid-$30,000.
Thursday, October 6, 2016

Veterans in San Juan County

ttps://public.tableau.com/profile/publish/NewVizforvets/StoryforVeterans#!/publish-confirm

The Department of Workforce Services has just published an interactive graphic on Utah veterans. Based on 2015 Census Bureau data, it allows researchers (and the simply curious) to “drill down” to veteran profiles at the county level. The department pays special attention to veterans for a number of reasons. Obviously, the nation is deeply obligated to veterans for their service. Veterans also make up almost 5 percent of Utah’s population and roughly half of veterans are of working age. Veterans have a higher disability proportion than the general public and sometimes have difficulty adapting their military skills to civilian uses. Given the potential for lost productivity, it also makes economic sense for society to concentrate on this population.

As an example of the information available and the potential for insights, this post will focus on San Juan County veterans. The veteran’s visualization profile has five profile segmentations, each represented by a “tab” above the graphs that one can click on.
The first tab is a broad overview of veterans statewide. The second tab details San Juan County veterans versus Utah veterans as a whole. San Juan County veterans in the 35-54 year-old age group (known as a cohort) are employed and participate in the labor force at a much lower rate than veterans in the state as a whole. While a larger part of this discrepancy can be explained by low participation rates in San Juan County as a whole, it is puzzling that County veterans participate less in the labor force than county nonveterans. This differs than the statewide profile; Utah veterans are more likely to be in the labor force than nonveterans.

The third tab shows median income for San Juan County by sex and veteran status. Two observations are especially noteworthy; the first is that the $101,390 estimate of female veteran strains credulity. Further examination of the data shows that the margin of era for the estimate is almost one third and the count of female veterans is very small. The data for male veterans is consistent (although at a lower income) with the experience of veterans statewide; veterans earn more their nonveteran counterparts.

The fourth tab shows veterans by era of service in detail.

Lastly, the fifth tab shows veterans by educational attainment and veteran’s status. The San Juan County profile shows that veterans have significantly more post-high school education than their nonveteran counterparts. However, San Juan County veterans have much less postsecondary educational attainment than Utah veterans statewide. This degree of the gap is somewhat surprising; usually an underrepresentation in the category holding bachelors degrees is (at least partially) compensated by an overrepresentation of the population holding associates degrees or advanced certificates. This is usually a result of the supply of jobs in a particular area. For example, Uintah count veterans have more associates degrees than veterans statewide because of the requirements of the oil and gas industry.

Tuesday, September 6, 2016

Age and Employment in Grand County

People work (and choose not to work) differently depending on where they live and how old they are. Obviously different people also prefer to live in different places. This can be because of employment opportunities, amenities, or even family ties. In like fashion, some industries attract a certain age demographic and are necessarily located in certain places.

The US Census Bureau tracks data like this and it allows economists to analyze the differences in age groups in different areas and industries.

The graph below shows employment by age in Utah and Grand County. The accommodation and food services sector was singled out due to Grand Country’s economic foundation; its economy is primarily tourist driven
It is obvious that the age make-up for the county and accommodation industry is different from Utah as a whole. The striking difference is in the 16-24 grouping (known as a cohort); the state has more workers in this cohort than the county but much less than the industry. It is likely that the difference between Utah and Grand County can be explained by the lack of four year universities in the area. In fact, it is quite typical for rural areas to be underrepresented in this cohort; young people tend to migrate to urban areas.

The 21 percent share for the accommodation sector in Grand County’s youngest age cohort is actually an under representation when compared to state-wide numbers; 37 percent of Utah’s accommodation sector workers are in the 16-24 years category. Other data from the U.S. Census Bureau’s American Community Survey suggests that the composition of this age group is markedly different from that of other rural counties. Roughly 7 percent of 18 through 24 year olds hold at least a bachelor’s degree. In contrast, the median level for the state (the measure that accounts for the rural nature of most counties) is only 3.6 percent. In fact, the level of educational attainment in this age group is on par with Utah’s “urban” counties that naturally attract educated young workers. A definitive explanation for this trend would require detailed survey work. However, the data suggests that Grand County benefits from the “river guide” effect. Young, educated workers come to the area for a post-bachelor degree association with mountain biking and white water rafting. Eventually, they migrate back to urban areas to start their professional lives.

Friday, July 29, 2016

The Infrastructure Labor Market


The labor force is made up of people. People vary in every conceivable way. One person is artistic while another can only draw stick people. One person might be able to disassemble and reassemble a car engine while another might not know what an alternator is. We are different. We have different aptitudes and abilities. Parallel to this variability, jobs are different. High levels of education do make it possible to work in high-skill occupations that return high incomes. But not everyone is cut out for higher education or has the means to obtain higher education. Therefore, they might end up in “lesser” or “unimportant” jobs. But is that accurate? Are their job options inferior and unimportant?

A recent Brookings Institution report brings to light a segment of the economy that is highly important yet is dependent upon the labor force that may not be built for, have the economic means, or desire to attain a college degree or higher. Brookings identifies a niche they call the infrastructure economy. As Brookings notes, “Infrastructure helps facilitate the exchange of information, drive production, and deliver resources, spanning multiple sectors of the economy and serving as a foundation to long-term growth.” It goes further to note that “Infrastructure jobs depend on a steady stream of talent to construct, operate, design, and govern the country’s major physical assets.” 

Brookings also documents why these infrastructure jobs can appeal to the individual. “Infrastructure occupations also boast competitive wages with relatively low barriers to entry, frequently paying up to 30 percent more to workers with a high school diploma or less compared to those in all other occupations. Plumbers, truck mechanics, and power line installers are among the numerous infrastructure occupations that fall into this category, which tend to emphasize on-the-job training rather than higher levels of formal education.”

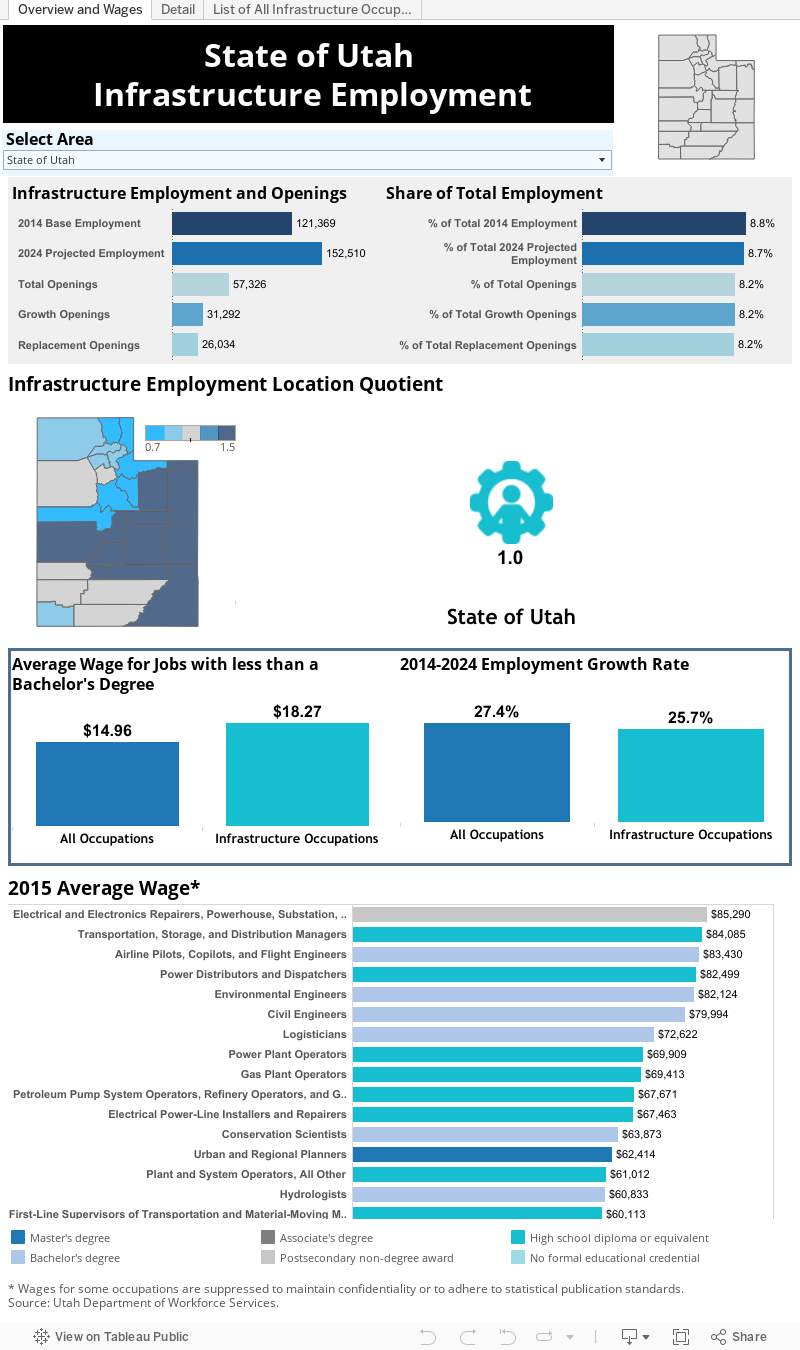
Brookings identified 95 occupations that support the infrastructure foundation. Their work was well founded and designed. This intrigued us to develop a profile of said infrastructure configuration for the Utah economy. We could not replicate the Brookings work in terms of finalizing upon infrastructure industries, but we could place our focus instead upon all infrastructure occupations. Infrastructure occupations do not have to be found in only infrastructure industries. A helicopter pilot, an infrastructure occupation, may fly a medical helicopter for a hospital, even though said hospital is not categorized as an infrastructure industry. What is important is that there are occupations that Brookings has identified as key occupations that help to keep the economy operating, growing, designed, and governed. And a practical appeal is that many of these jobs offer low barriers to entry while supplying competitive wages.

 Across the nation, these occupations number 11.9 million, or 8.8 percent of all occupational employment. In Utah, these jobs number around 121,400, also 8.8 percent of all occupational employment. Again, the appeal of these jobs is not just that they fundamentally support so many other jobs and industries in the economy, but that these jobs don’t require a high level of education or formalized training for entry. Oftentimes these occupations emphasize only on-the-job training. Yet, these jobs pay on average 22 percent higher in Utah than other occupations that are willing to accept only a high school diploma or less.

Utah’s higher proportion of employment relative to the nation in various infrastructure occupations include reservation and transportation agents/clerks, transportation inspectors, transportation attendants, forest and conservation technicians, petroleum refinery operators, and airfield operations specialists, among others. Utah does have its unique structuring across its different geographic regions, and this will include the possibility of a different profile of the Infrastructure economy in each local region.

The following is an infrastructure profile for the Carbon, Daggett, Emery, Grand, San Juan, and Uintah Counties, collectively known as the Eastern Region. Eastern Utah There are 7,165 infrastructure jobs in the Eastern Region. This constitutes 14 percent of all employment. Relative to the U.S., these jobs are more concentrated in the region; infrastructure jobs are 1.5 times more prevalent in this region than they are nationally.

The Eastern Region economy is dominated by natural resource extraction, and there is considerable overlap between this industry and infrastructure related occupations. Most prominently represented are heavy truck and tractor-trailer drivers. These jobs are 3 times more prevalent in the region than in the U.S. economy as a whole. In 2014, there were 2,402 truck driving jobs in the Eastern Region, or a third of the infrastructure job base. That occupation is expected to grow by 7.5 percent by 2024. The 2015 median wage was $23.39/hour, which is considerably above the statewide wage of $20.37/hour. 

Infrastructure jobs in the U.S. are projected to grow at 7.8 percent by 2024. This is slightly less than the 8.1 percent projected for the Eastern Region as a whole. Accordingly, the share of infrastructure jobs nationally is projected to decline slightly from 2014 levels. Infrastructure jobs requiring less than a Bachelor’s degree pay roughly 32 percent more than similar jobs in the overall Eastern Utah economy. The employment-weighted median wage for jobs not requiring a college degree is $22.70/hour; the analogous number for non-infrastructure jobs is $17.25/hour.

These jobs usually require moderate educational attainment. Almost 43 percent of these occupations require a high school diploma or equivalent. About an equal percentage require some post-secondary education. Only 13 percent of the occupations are open to workers with less than high school education.

 Infrastructure occupations usually require at least modest on-the-job training. Some 55 percent of occupations involve short term training. Long term on-the-job training is required for 20 percent of infrastructure jobs

Wednesday, April 20, 2016

Southeast Region Market Information is “OnTheMap”

Southeast Region Market Information is “OnTheMap”

The Census Bureau’s online mapping tool provides a wealth of location-specific labor market information

“If you want to put yourself on the map, publish your own map.” - Ashleigh Brilliant

This isn’t your same old blog post about data. Instead of analyzing and sharing data, this post covers how to access an extremely useful “big data” labor market information tool. What is this tool? The U.S. Census Bureau’s OnTheMap web-based mapping and reporting application. 

What’s so great about OnTheMap? Typically, we report labor market information at the state and county level. Local-level data is harder to come by. Along with the ability to provide labor market profiles of small and large nonstandard areas, OnTheMap graphically demonstrates where people work and where workers live. Users can define their own geographies and obtain data and maps at the census-block level of detail. This flexibility can quickly provide information for emergency and transportation planning, site location and economic development.
  • Do you want to understand commuting patterns for a particular area? OnTheMap can generate maps of outflow and inflow. 
  • Do you want to know the basic characteristics of workers in your town? OnTheMap has that information. 
  • Do you want to identify the employment characteristics along a specific stretch of highway? OnTheMap can deliver that data. 
  • Do you want to discern how many workers live within a 50-mile radius of a particular site?OnTheMap delivers.
Where does this data come from? OnTheMap combines federal and state administrative data on workers and employees with Census Bureau census and survey data. Don’t worry. Using state-of-the-art methods, the Census Bureau is committed to protecting the confidentiality of business and personal information.

Where People Work

Let’s run through a few examples of how OnTheMap outputs can help you understand your local economy. Suppose the Moab City Council wants to know where the residents of their town work. OnTheMap indicates more than half of the city’s working residents are employed in the city. 

Next, the mayor wants to know how many workers travel into Moab for employment. OnTheMap suggests that far more workers commute in than out of Moab. In-commuters are most likely to drive significant distances into Moab.


Labor Market Characteristics

Now, these local government officials have decided they would like to know the characteristics of those folks that work or live in Moab. OnTheMap can provide age-group, earnings, industry, race/ethnicity, gender and educational attainment information. For example, OnTheMap shows the following characteristics for working residents of Moab:

·         One-fourth are 29 years or younger
·         23 percent make more than $3,333 a month
·         36 percent work in Accommodation and Food Services.
·         8 percent are Latino
·         17 percent have at least a Bachelor’s degree
·         45 percent are female

Getting Specific


A company thinking of locating to Moab is interested in the number (and characteristics) of workers within a standard commuting distance of a particular worksite. Economic development professionals can specify a particular radius and obtain a report. Other shapes (donut and plume) are also available. In addition, users can draw their own polygons in OnTheMap. To determine how many workers may be inconvenienced by a road construction project, just draw a line along the length of the project and “buffer” the selection. 


Friday, January 29, 2016

Educational Profile of the Southeast Region

Scott Smith, Regional Economist


The American Community Survey (ACS) is a statistical survey administered by the U.S. Census Bureau. It regularly gathers information previously contained only in the long form of the decennial census, such as educational attainment, income and housing characteristics by age and sex. Sent to 3.54 million addresses annually, it is the largest survey (other than the decennial census) that the Census Bureau administers.

The ACS offers insights how the country’s workers of varying educational attainment are distributed and how they are compensated.

As a point of reference, on average, U.S. workers who possess less than a high school diploma earn $19,954. High school graduates earn $27,868. Workers who earned an associate’s degree or attended college earned $33,988. College graduates earn $50,515. Recipients of graduate degrees make $66,944.
Nationally, men make more than women. For example, women earn between 32 and 34 percent less than males with equivalent educational background. Some, but not all, of this difference can be explained by a significant proportion of women who choose part-time employment.

The ACS also maps the composition of the labor force by highest educational attainment. Nationally, roughly 12 percent of the 25-year-and-older population has not graduated from high school. Almost 27 percent of the population has a high school diploma while 31 percent has advanced to an associate’s degree or has attended university. A little more than 30 percent has a bachelor’s degree.

What follows is a comparison of the population of the counties in the Southeast Region against the national statistics.

Grand County

On average, Grand County residents who possess a high school diploma earn $31,396. Workers who have earned an associate’s degree or attended college earn $23,051. College graduates earn $31,174. The reader should regard these median income statistics with some skepticism; analysts speculate that they are a product of large sampling errors. Holders of graduate degrees substantially out earn bachelors, $53,000 compared to $31,174.

Workers in Grand County earn 70 percent of the U.S. median. With respect to gender, women in the county earn 65 percent of men’s wages, while the analogous U.S. figure is 72 percent; however, these figures are suspect. This is evidenced in the ACS reports that women with less than a high school education earn 195 percent of the equivalent man’s income, while women who hold bachelor’s degrees only make 37 percent.

High school graduates in Grand County earn 113 percent of the U.S. median. Men earn 104 percent of the U.S. median for men, while women earn 106 percent of the U.S. median for women. Grand County residents who hold an associate’s degree or have attended college make 68 percent of the U.S. average. Men earn 61 percent of the U.S. median, while women earn 66 percent. College graduates in Grand County make 62 percent of the U.S. median. Men earn 66 percent of the U.S. median for men; in contrast, women earn only 32 percent of the U.S. median for women. Recipients of graduate degrees earn 79 percent of the U.S. median. Men make 65 percent, while women make 60 percent of their respective median.

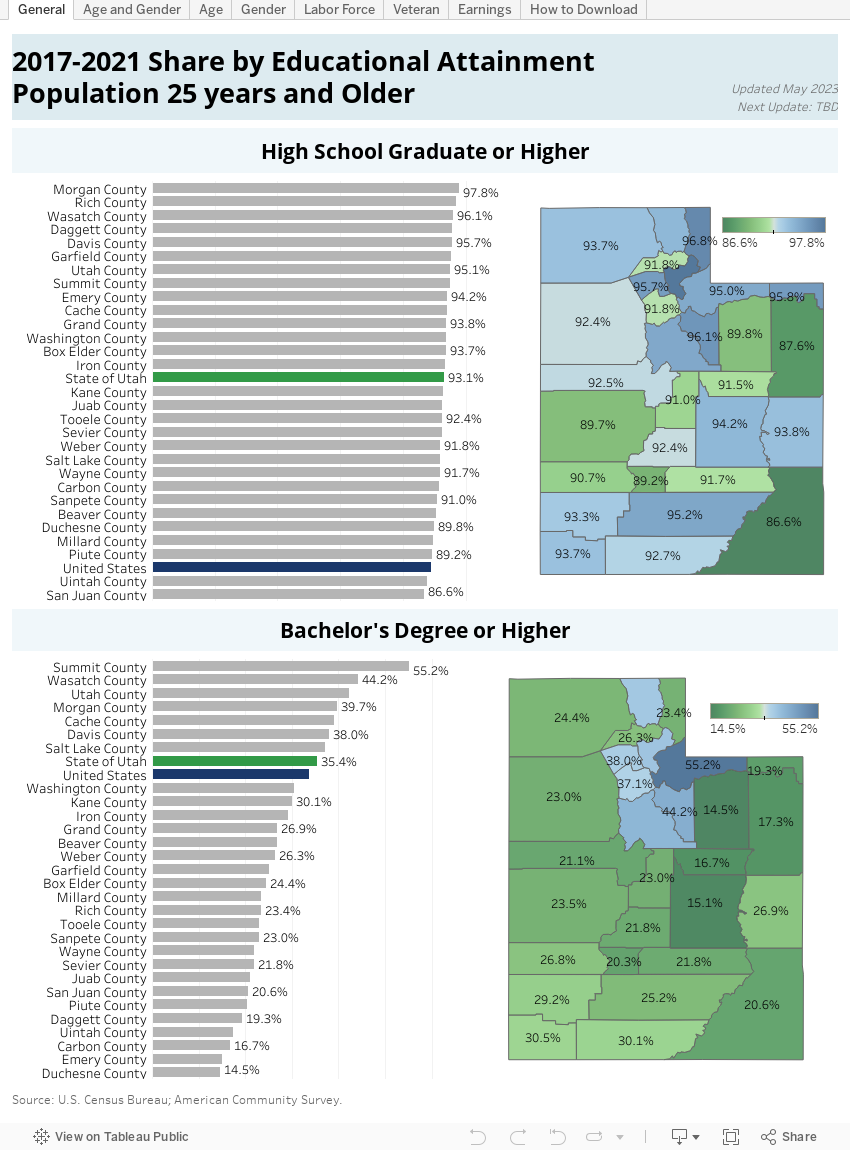
Grand County’s population differs from the U.S. by educational attainment. Almost 43 percent of the county’s population reports holding an associate’s degree or having attended college — the national number is 31 percent. Only 22 percent of the county’s population holds at least a bachelor’s degree — the national figure is 31 percent.

San Juan County 

San Juan County who possess less than a high school diploma earn on average $18,906. High school graduates earn $24,705. Workers who have earned an associate’s degree or attended college earn $28,333. College graduates earn $41,354. Recipients of graduate degrees make $49,694.

Workers in San Juan County earn 82 percent of the U.S. median. With respect to gender, women earn 60 percent of men’s wages, while the analogous U.S. figure is 72 percent. It is interesting to note that women in San Juan County with college educations perform better than their national counterparts. Women with bachelor’s degrees earn 72 percent of their male counterparts’ income, while women who hold graduate degrees earn 90 percent of their male coworkers’ income. High school graduates in the county earn 89 percent of the U.S. median. Men earn 97 percent of the U.S. median for men, while women earn only 64 percent of the U.S median for women. San Juan County residents who hold an associate’s degree or have attended college make 83 percent of the U.S. median. Men earn 92 percent of the U.S. median, while women earn 81 percent of their respective statistic. College graduates in San Juan County make 81 percent of the U.S. median. Men earn 72 percent of the U.S median for men; in contrast, women earn 77 percent of the U.S. median for women. These statistics are suspect due to large sampling error. Recipients of graduate degrees earn 74 percent of the U.S. median. Men make 64 percent of the median; surprisingly, women make 86 percent of the median for women with graduate degrees.

San Juan County’s labor demographics differ markedly from the nations because of participation rates and educational attainment. For individuals with less than a high school education, more than 7.9 percent of the county population is not in the labor force — the U.S. number is 4.7 percent. More than 15 percent of county residents with a high school diploma do not participate in the labor market. The analogous national number is a little more than 7 percent. The county also has less college graduates than the nation as a whole — 19 percent of the county’s population possesses a bachelor’s degree of higher (the national figure is 31 percent).

Wednesday, November 4, 2015

Reviewing the 2012 Agricultural Census for the Southeast Region

Scott Smith, Regional Economist


The 2012 Census of Agriculture is just that — a census. It is an attempt to count an entire population and generally does not use sampling or statistical techniques to make conclusions about the population. It is conducted every five years and includes all farm operators regardless of whether farming is their primary or secondary occupation. Operators and hired laborers are combined for a total count. There can be a maximum of three operators per farm, but labor hired on a contract basis is not covered.

The Southeast Region agriculture is largely devoted to the livestock business, this by raising cattle or growing hay. There is also some wheat farming worth noting in San Juan County. 2012 net cash income per farm for Grand County was -$3,725. The analogous figure for San Juan County was -$1,522. The vast majority of farms have annual total sales less than $250,000.

Southeast Region 2012 employment was 1,679 jobs according to the census (this number may slightly differ from other data presented because of confidentiality issues). The state’s unemployment insurance data suggests that a very small number of these jobs generate the income or possess the duration to be considered “full time” employment in the urban sense. Further data indicates that most farmers and ranchers are sole proprietors (regardless of how they are organized for tax purposes). Finally, a comparison of the other sources and the census figures shows that most individuals involved in agriculture have their primary job in other sectors of the economy.

The size and composition of the agricultural workforce has changed markedly over time. In 2002, the total Southeast Region agricultural workforce was 839 workers, of which 40 percent was hired labor. That total increased by 112 percent to 1,776 in 2007, yet the share of hired laborers fell to 16 percent in the same period (although this statistic may be skewed downward because of reporting issues). In 2012, the agricultural employment count fell 5 percent to 1,679 and the share of hired labor increased slightly to 20 percent.

In 2002, the labor cost per worker (as defined by dividing annual labor expense by the hired workforce) was $1,270. In 2007, the cost had fallen by 33 percent to $850. In 2012, this number had increased by 15 percent to $980. In contrast, inflation increased by 15 percent and 9 percent as of 2007 and 2012, respectively.

There were 325 principal operators in the Southeast Region in 2002 (the statistics refer to “principal” operator and therefore will not agree with other totals). The number of operators increased to 848 in 2007, which is an astounding 161 percent increase. The count dropped slightly to 827 in 2012. The share of operators relying on other sources of employment has been remarkably constant. In 2002, the proportion was 41 percent. It dropped slightly to 40 percent in 2007. The share then increased to 46 percent in the 2012 Census.

Analysts are unable to convincingly explain the employment patterns with income statistics. One would expect to observe the number of operators falling in concert with the decline in income. Similarly, one should expect that operators would seek other sources of employment when income declines. Farm income per operator was $2,723 in 2002, and then decreased 300 percent to -$2,085 in 2007. In 2012, income per operator declined another 19 percent with a total of -$1,738.


Monday, August 3, 2015

Local Insights updated on the web

By Mark Knold, Supervising Economist 

Shelter is one of humanity’s basic needs. That is why housing is everywhere. Since housing is so ubiquitous, it becomes an important component in an economy’s foundation, and as such becomes an economic indicator.

In this issue of Local Insights, we look at the demand for housing structures, the amount of housing permits and their history, and how this history shows that housing demand follows the ups and downs of a region’s economic performance. In evaluating the volume of housing permits, we also parallel the health and vitality of the local economy.

People need jobs that supply them income in order to afford housing. Jobs are not the only factor, as things like affordability and the ability to obtain lending also play their part in housing demand. But the foundation of housing demand is the health of the job market.


The graph shows Utah statewide housing permits. A trend of normal permitting activity is evident from 1996 through 2004. Permits rose during the pre-Great Recession boom, then became lethargic for the seven years following. It is just recently that the volume of permit activity is again approaching something normal. That in itself is an economic indicator of an improved Utah economy.


--------------------------------------------

To read more, see the latest issues of Local Insights. To receive a printed copy, please call 801-526-9785.